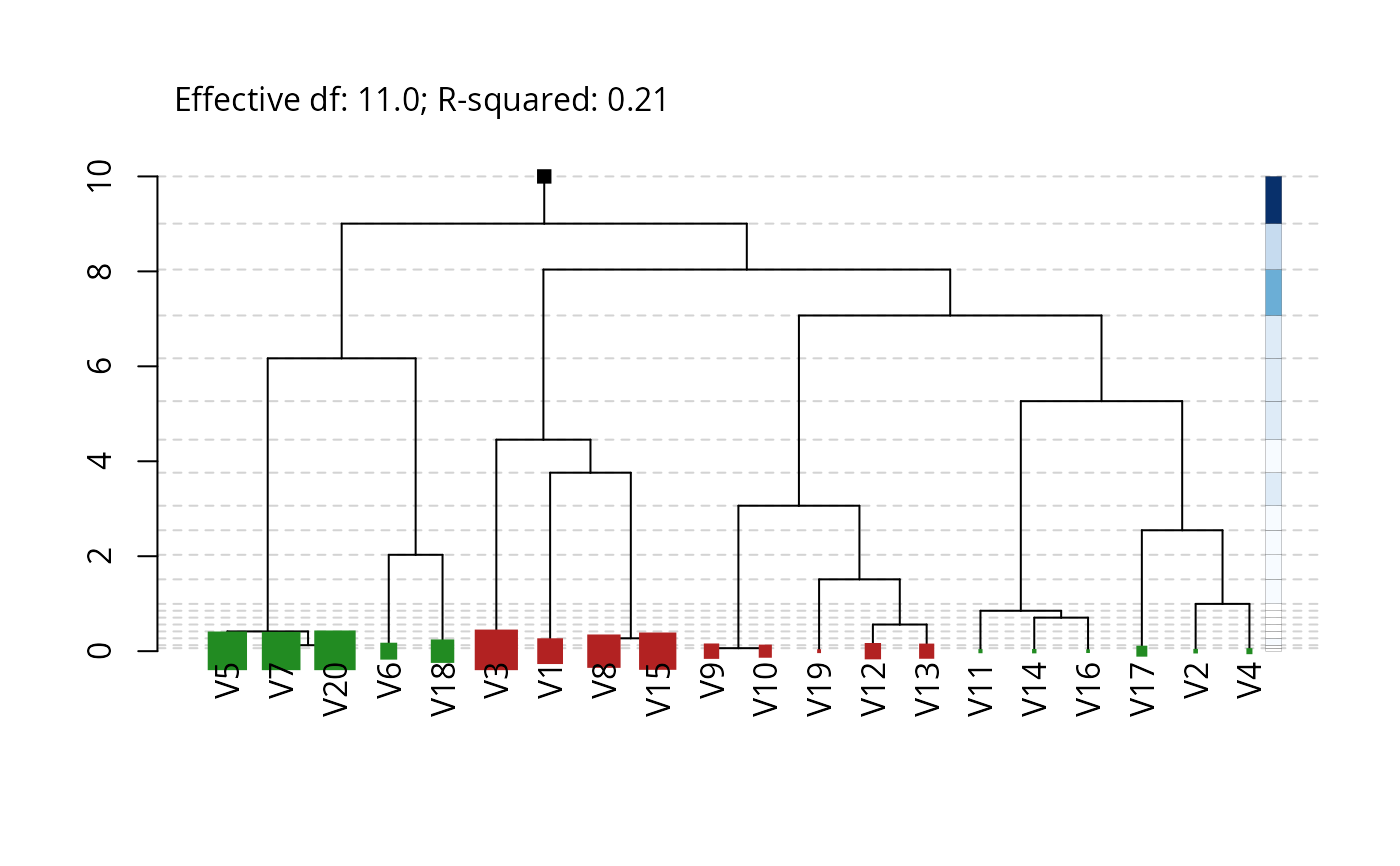
Plots the dendrogram of a fitted cv.hfr model. The heights of the
levels in the dendrogram are given by a shrinkage vector, with a maximum (unregularized)
overall graph height of \(p\) (the number of covariates in the regression).
Stronger shrinkage leads to a shallower hierarchy.
Usage
# S3 method for cv.hfr
plot(x, kappa = NULL, show_details = TRUE, max_leaf_size = 3, ...)
Arguments
- x
Fitted 'cv.hfr' model.
- kappa
The hyperparameter used for plotting. If empty, the optimal value is used.
- show_details
print model details on the plot.
- max_leaf_size
maximum size of the leaf nodes. Default is
max_leaf_size=3.- ...
additional methods passed to
plot.
Details
The dendrogram is generated using hierarchical clustering and modified
so that the height differential between any two splits is the shrinkage weight of
the lower split (ranging between 0 and 1). With no shrinkage, all shrinkage weights
are equal to 1 and the dendrogram has a height of \(p\). With shrinkage
the dendrogram has a height of \((\kappa \times p)\).
The leaf nodes are colored to indicate the coefficient sign, with the size indicating the absolute magnitude of the coefficients.
A color bar on the right indicates the relative contribution of each level to the coefficient of determination, with darker hues representing a larger contribution.